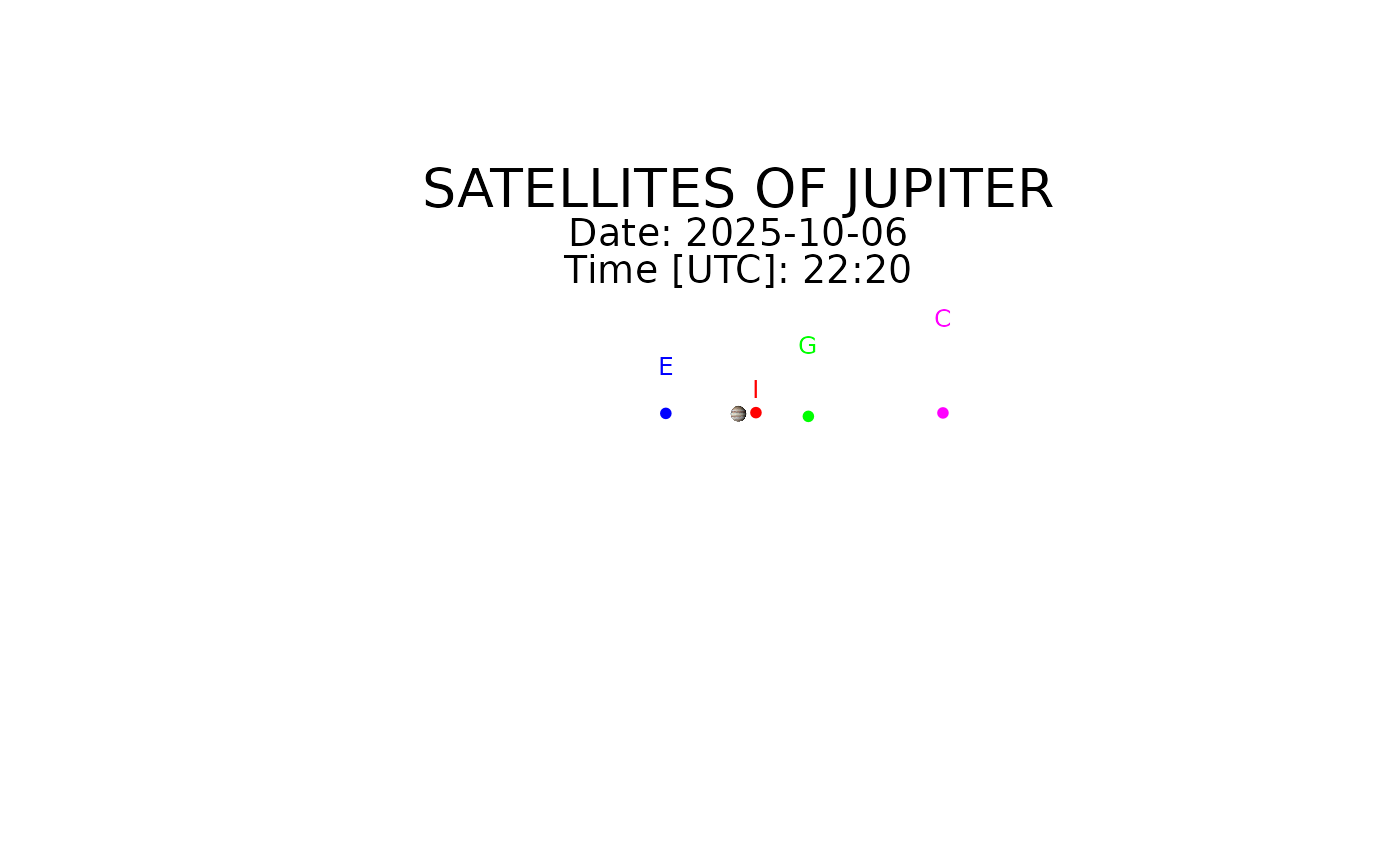
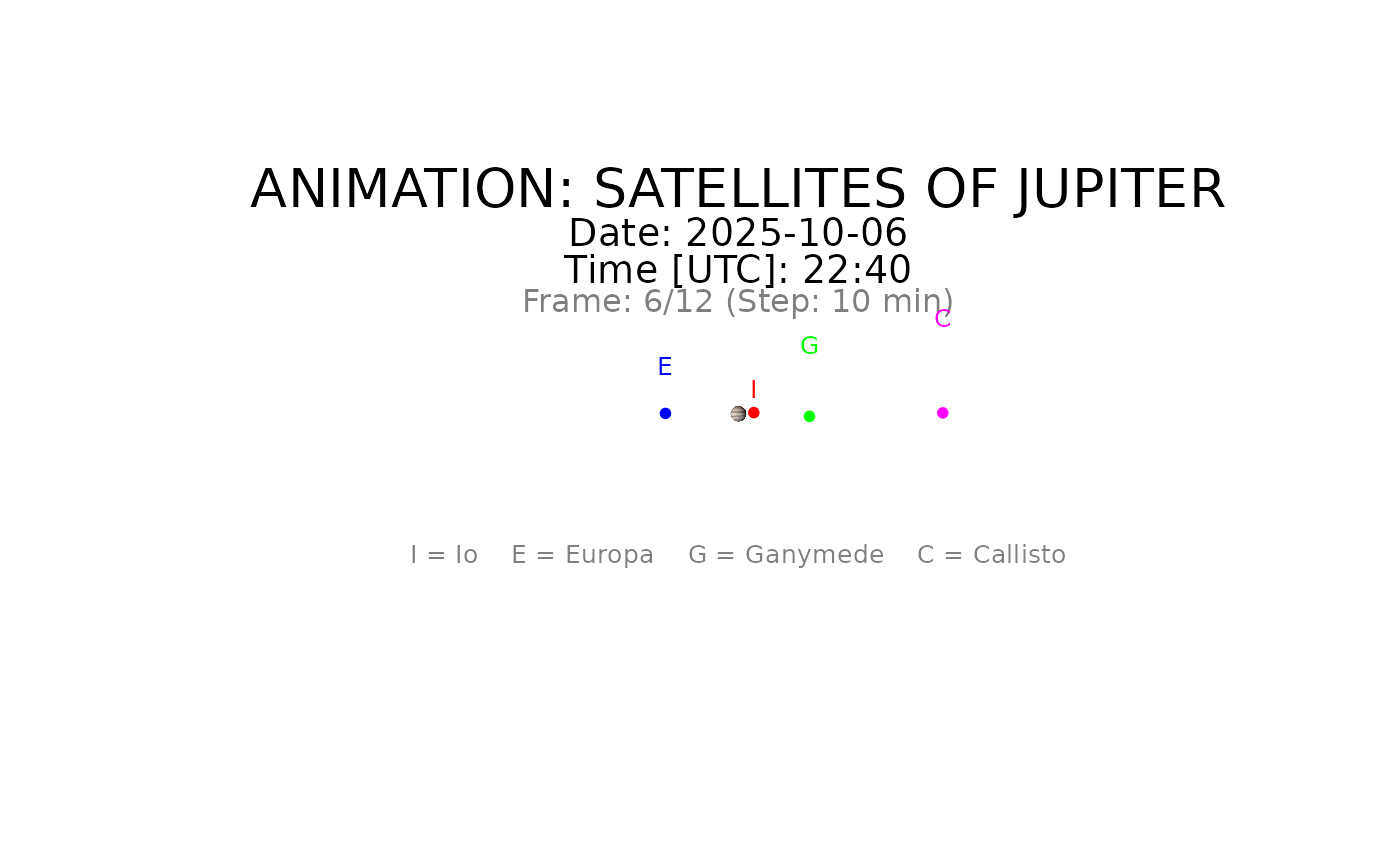
Animate the motion of Jupiter's Galilean satellites
galsat_animate.Rdgalsat_animate() creates an animation showing the orbital motion of Jupiter's
four largest satellites over time. The function starts from a user-specified
time and advances in regular intervals to show how the moons move around Jupiter.
Usage
galsat_animate(
  year,
  month,
  day,
  hour,
  minute,
  duration_hours = 24,
  time_step_minutes = 5,
  pause_seconds = 0.05
)
Arguments
- year
Type in the starting year (integer number from 0 to 3000).
- month
Type in the starting month (integer number from 1 to 12).
- day
Type in the starting day (integer number from 1 to 31).
- hour
Type in the starting hour (integer number from 0 to 23).
- minute
Type in the starting minute (integer number from 0 to 59).
- duration_hours
Duration of the animation in hours (default 24).
- time_step_minutes
Time step between frames in minutes (default 5).
- pause_seconds
Pause between frames in seconds (default 0.05).
Value
Creates an animated plot showing the orbital motion of Jupiter's moons. Returns invisibly the final positions data frame.